Blog
Blog
The Ultimate Power Guide to Lithium Battery Voltage Charts (Explained Simply)
Published by Dawnice, December 26, 2025
Understanding Lithium Battery Voltage: Why It Matters
A lithium battery voltage chart is one of the most practical tools for understanding how your battery performs in real life. Whether you are using a 12V lithium battery, a 48V LiFePO4 system, or a lithium ion cell, voltage tells you how full the battery is, how healthy it remains, and when it should be charged or discharged.
Unlike traditional lead-acid batteries, lithium batteries maintain a stable voltage across most of their discharge cycle. This makes them more efficient, predictable, and reliable for solar storage, RVs, marine systems, and off-grid applications.
What Is a Lithium Battery State of Charge (SOC) Chart?
A lithium battery state of charge chart shows the relationship between voltage and remaining capacity (percentage). For example, a 12V LiFePO4 battery voltage chart usually shows:
-
100% SOC ≈ 13.4–13.6V
-
50% SOC ≈ 13.0V
-
20% SOC ≈ 12.8V
Compared with lead-acid batteries, lithium voltage drops more slowly, which is why SOC estimation must rely on accurate voltage charts or a battery monitor.
LiFePO4 Battery Voltage Chart Explained
A LiFePO4 voltage chart is slightly different from standard lithium-ion charts. LiFePO4 chemistry offers higher safety, longer lifespan, and a flatter discharge curve.
Typical LiFePO4 cell voltage values:
-
Fully charged: ~3.65V
-
Nominal voltage: ~3.2V
-
Minimum safe voltage: ~2.5V
That means a 12V LiFePO4 battery voltage chart (4 cells in series) ranges from about 10V to 14.6V depending on charge level.
12V, 24V, and 48V Battery Voltage Charts
Different system voltages follow the same principle but scale upward:
-
12V lithium battery voltage chart → 10–14.6V
-
24V LiFePO4 voltage chart → 20–29.2V
-
48V lithium battery voltage chart → 40–58.4V
For example, a 48V LiFePO4 battery full charge voltage is typically 58.4V, while nominal voltage sits near 51.2V. These values are essential for solar inverters, EV chargers, and energy storage systems.
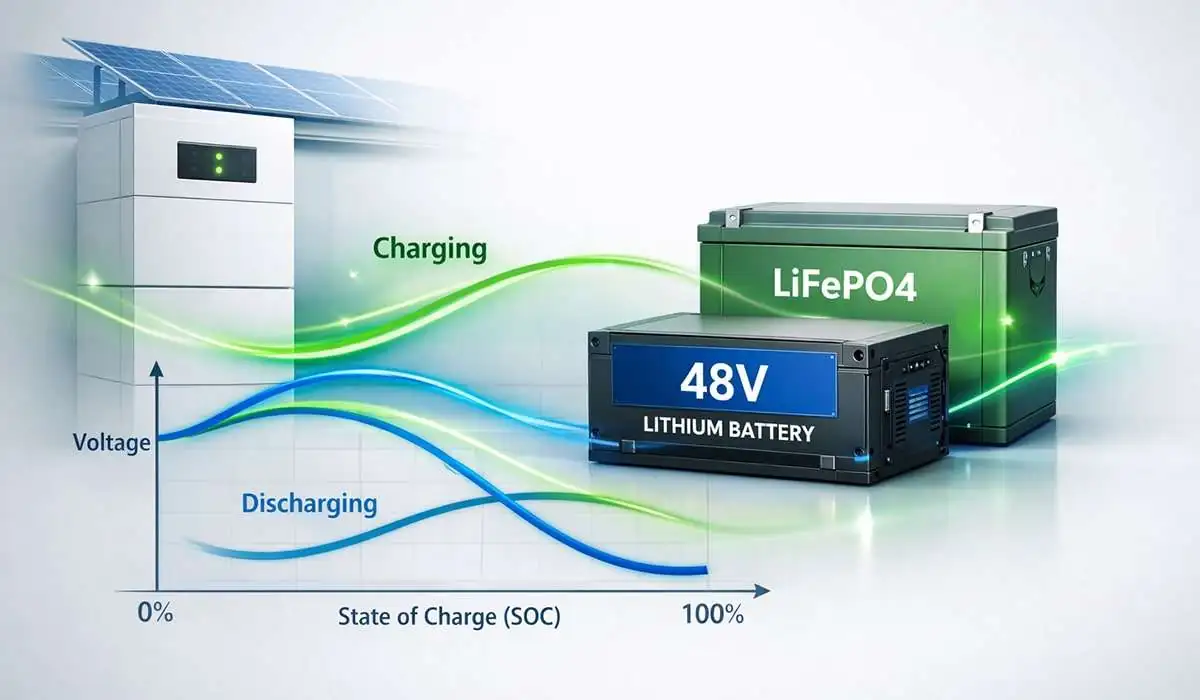
Lithium Battery Charging Chart vs Discharging Curve
A lithium battery charging chart looks very different from a lithium discharge curve. Charging voltage rises quickly, then stabilizes during constant voltage (CV) mode.
Key points:
-
Charging voltage is higher than resting voltage
-
Overcharging shortens battery life
-
Proper chargers follow a controlled charge curve
This applies to LiFePO4 charging charts, lithium-ion charging voltage, and even 12V lithium battery charging voltage systems.
Lithium Ion vs LiFePO4 Voltage Differences
A standard lithium-ion battery voltage chart (such as 18650 cells) shows:
-
Fully charged: ~4.2V
-
Nominal voltage: ~3.7V
-
Cutoff: ~3.0V
In contrast, LiFePO4 voltage charts operate at lower voltages but offer far better cycle life and safety. That’s why LiFePO4 batteries are preferred for energy storage, RVs, marine systems, and off-grid setups.
How to Read Battery Voltage in Real Applications
Whether you’re using a marine battery voltage chart, RV battery voltage chart, or golf cart battery voltage chart, the logic remains the same:
-
Voltage indicates energy level, not capacity health
-
Temperature affects readings
-
Resting voltage is more accurate than active charging voltage
For precise monitoring, many users rely on a battery management system (BMS) or smart monitor instead of voltage alone.
Final Thoughts: Choosing the Right Lithium Voltage Chart
Understanding a lithium battery voltage chart helps prevent overcharging, deep discharge, and premature aging. Whether you’re checking a 12V LiFePO4 battery voltage chart, a 48V lithium-ion battery voltage chart, or a battery SOC chart, accurate knowledge improves performance and lifespan.
For modern energy storage systems—especially solar and hybrid setups—choosing the right lithium battery and understanding its voltage behavior is essential for long-term reliability and safety.