How to Identify LiFePO4 Battery Cell Quality: The Ultimate Guide to Spotting Fake Grade A Cells
How to Identify LiFePO4 Battery Cell Quality: The Ultimate Guide to Spotting Fake Grade A Cells
The Sourcing Minefield: Why You Can’t Trust a Label to Identify Battery Cell Quality
In the global energy storage market, every supplier claims to offer “100% Brand New, Grade A Cells.” Yet, the price gap between two battery packs with identical specifications can vary by hundreds of dollars. If both claim to be top-tier, why is one so drastically cheaper?
The truth is, looking at a spreadsheet or reading a silk-screened label on top of a cell tells you almost nothing. The lithium-ion supply chain has developed sophisticated ways to pass off substandard, aged, or mismatched cells as premium inventory. For solar distributors, system integrators, and installers, failing to accurately identify battery cell quality doesn’t just mean a loss of efficiency—it guarantees premature system failure, high warranty claims, and severe damage to your brand’s reputation. Let’s look at the actual engineering metrics required to separate real value from low-price traps.
The Three Hidden Traps in “Grade A” Claims
Before you can inspect a cell, you must understand what you are actually fighting against. Unscrupulous factories rely on three main tactics to disguise inferior battery cells:
-
Software-Healed Parameters (The Fake Match): Cheap manufacturers purchase cells with severe capacity and resistance deviations (+/- 2% to +/- 5%). Instead of physically sorting them, they program the Battery Management System (BMS) to artificially balance the readings. On a monitor, it looks perfect. In the field under a heavy load, the system crashes.
-
The “Zombie” Dead Stock: These are genuine Grade A cells, but they have sat neglected in unconditioned warehouses for over a year. While technically “unused,” their internal chemical structures have degraded, spike rates are high, and capacity is already on the decline.
-
A-Minus (A-) Reselling: When top-tier factories finish a production run, cells that fail strict consistency thresholds are rejected. These are “A-minus” cells. They look flawless on the outside, but they lack the cell-to-cell consistency required for a long-lasting multi-cell battery pack.
The Technical Blueprint: 4 Metrics to Instantly Identify Cell Quality
To truly identify battery cell quality during a factory audit or sample testing, you must look at the physical chemistry and data consistency. True Grade A engineering relies on four non-negotiable pillars:
-
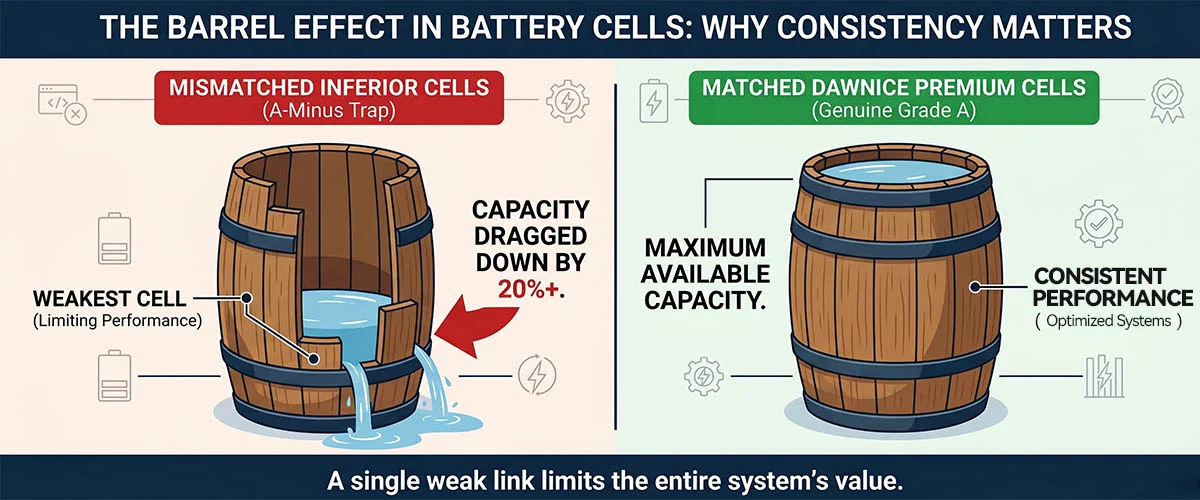
Capacity Deviation (<= +/- 1%): Premium cells must show an incredibly tight capacity margin. If a cell drops below its nominal rating or varies widely from the rest of the pack, the “Barrel Effect” takes over. The entire battery pack’s capacity will be throttled by the single weakest cell.
-
Open Circuit Voltage (OCV <= 3mV): When tested at a steady State of Charge (typically 25% SOC), the voltage difference between cells must be virtually non-existent (<= 3mV). A wide voltage gap indicates poor internal chemistry and rapid cell aging.
-
Strict Internal Resistance Matching (<= +/- 10%): Mismatched internal resistance causes cells to heat up at different rates during fast charging and discharging. This creates localized hot spots within the battery pack, accelerating thermal degradation.
-
Low Self-Discharge Rate (< 20mV over 30 Days): High-quality cells hold their charge when idle. If a cell loses more than 20mV over a month of ambient storage, its internal separator is likely compromised, marking it as a high-risk component.
The Dawnice Standard: Our “6-Formula” Internal Verification Process
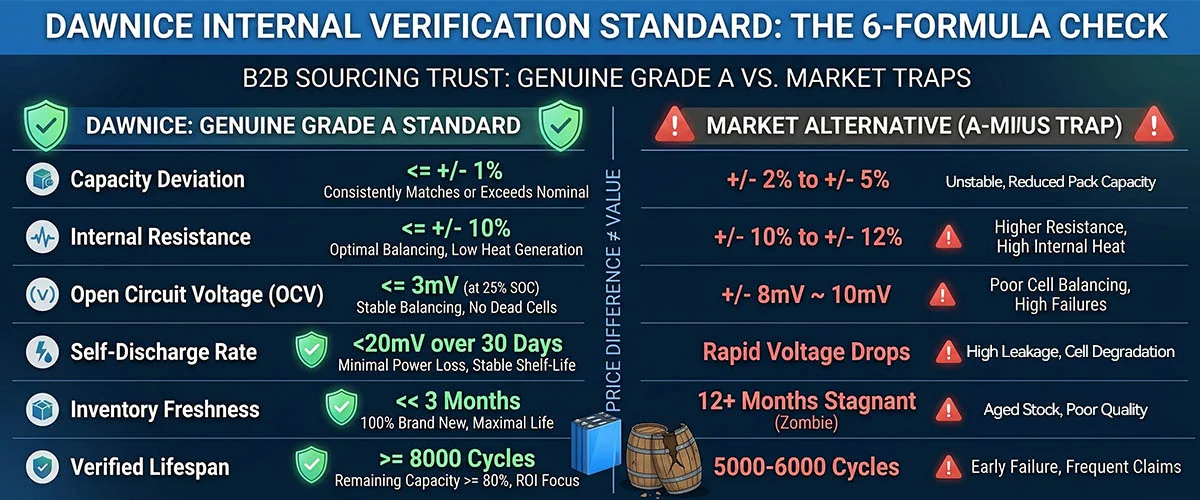
At Dawnice, we don’t take a supplier’s word for granted. Every single batch of cells entering our production line must pass through our strict “6-Formula Authenticity Check” to verify its real-world value against market claims:
-
1. Capacity Deviation: Dawnice keeps it at <= +/- 1% (consistently matches or exceeds nominal capacity), while standard market A-minus cells show +/- 2% to +/- 5% unstable capacity.
-
2. Internal Resistance: Dawnice enforces <= +/- 10% versus the factory baseline, while market alternatives fluctuate between +/- 10% and +/- 12%, leading to high internal heat generation.
-
3. Open Circuit Voltage: Dawnice locks OCV at <= 3mV (at 25% SOC), while low-cost competitors allow +/- 8mV to 10mV, resulting in poor cell balancing.
-
4. Self-Discharge: Dawnice guarantees a voltage drop of less than 20mV over 30 days, while inferior cells experience rapid voltage drops due to high internal leakage.
-
5. Inventory Freshness: Dawnice uses cells that are fresh from the factory line within 90 days (<< 3 months), while others utilize 12+ months stagnant “Zombie” stock.
-
6. Verified Lifespan: Dawnice cells achieve >= 8000 cycles with remaining capacity >= 80%, whereas A-minus packs drop off early, failing between 5,000 and 6,000 cycles.
Moving Beyond the Price Tag to Long-Term Business Value
When building or scaling an energy storage business, cells represent approximately 70% of your total hardware cost. When a competitor offers a price that seems impossibly low, they haven’t found a secret manufacturing shortcut—they have simply compromised on cell selection.
By using cells that maintain a tight capacity deviation (<= +/- 1%) and fresh stock under 90 days old, Dawnice delivers systems guaranteed to hit >= 8000 cycles. We deliberately operate on a slim 3% factory margin to keep our prices highly competitive, but we refuse to cut corners on the internal chemistry. We back this up by providing fully transparent, original factory cell testing reports to our distributors.
Identifying battery cell quality is ultimately about protecting your bottom line. Investing in verified cell consistency means fewer truck rolls, zero catastrophic failures, and partners who trust your brand for the next decade.