Battery Backup Time Calculation: 50/100/200kWh Runtime Guide
Battery Backup Time Calculation: 50/100/200kWh Runtime Guide
Battery Backup Time Calculation: How Long Does a 50kWh, 100kWh or 200kWh Commercial BESS Last?
A spec sheet says 100kWh. The first question every commercial buyer asks is more practical than that: how many hours does that actually give me? For a facility manager, EPC contractor or business owner, battery backup time calculation is the number that turns a datasheet into a decision, yet it is rarely printed on any product page.
In practice, the answer depends on four variables: usable capacity (nominal kWh after the depth-of-discharge limit), load power (what your site actually draws, in kW), discharge rate (the C-rate the battery and BMS can sustain), and system efficiency (inverter plus wiring losses). Miss any one of them, and your runtime estimate can be off by 40 percent or more. This article walks through the battery runtime formula with a worked example, provides full runtime tables for 50kWh, 100kWh and 200kWh commercial battery backup systems, then adds a simple ROI and payback framework so you can size for hours and dollars at the same time.
The Battery Runtime Formula
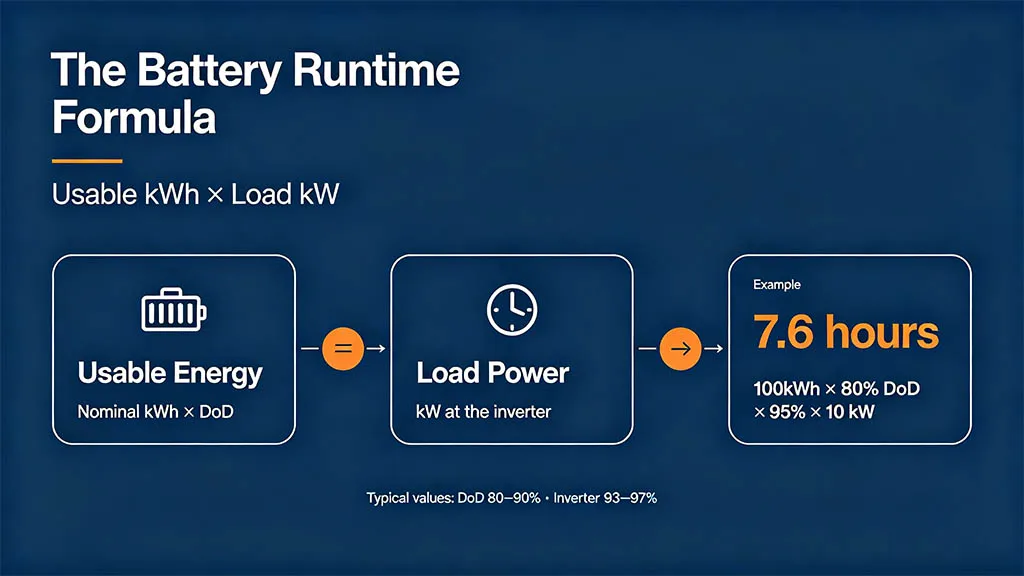
At its core, the battery runtime formula is two values divided: Runtime (hours) = Usable Energy (kWh) ÷ Load Power (kW). In practice, every runtime calculation is this equation once the two inputs are defined correctly.
Usable Energy is not the nominal capacity printed on the label; it is Nominal kWh × Depth of Discharge (DoD). A LiFePO4 commercial battery is typically operated between 80 percent and 90 percent DoD to protect cycle life, so a 100kWh battery gives you 80 to 90kWh of usable energy, not 100.
Load Power is the continuous AC draw of the connected equipment, measured at the inverter output in kW. Because no component in the chain is lossless, the battery must deliver more than the AC load: AC Load kW = DC Battery kW × Inverter Efficiency. Rearranged, the battery runtime calculation becomes Runtime = (Nominal kWh × DoD × Inverter Efficiency) ÷ AC Load kW.
For example, a 100kWh battery at 80 percent DoD with a 95 percent inverter efficiency and a steady 10kW AC load. Usable energy = 100 × 0.8 = 80kWh, so the theoretical runtime is 80 ÷ 10 = 8 hours. Then, apply inverter efficiency: 80 × 0.95 = 76kWh of usable AC energy, or 7.6 hours. Add realistic wiring and BMS parasitic losses of roughly 5 percent and the real-world figure lands near 7.2 hours. That is the difference between a battery runtime formula done on paper and one done against the real system.
As a result, every credible battery runtime calculation starts from usable kWh, not nameplate kWh. The rest of this article applies it at scale across 50kWh, 100kWh and 200kWh systems.
Runtime Tables: 50kWh vs 100kWh vs 200kWh
Below, the tables apply the battery runtime formula directly. Table 1 assumes 80 percent DoD and 95 percent inverter efficiency, which is the conservative standard for commercial LiFePO4 BESS. Each cell is (Nominal kWh × 0.8 × 0.95) ÷ load in kW. Read the row for your expected load and the column for your battery size: that is the theoretical runtime before temperature, aging and surge derating.
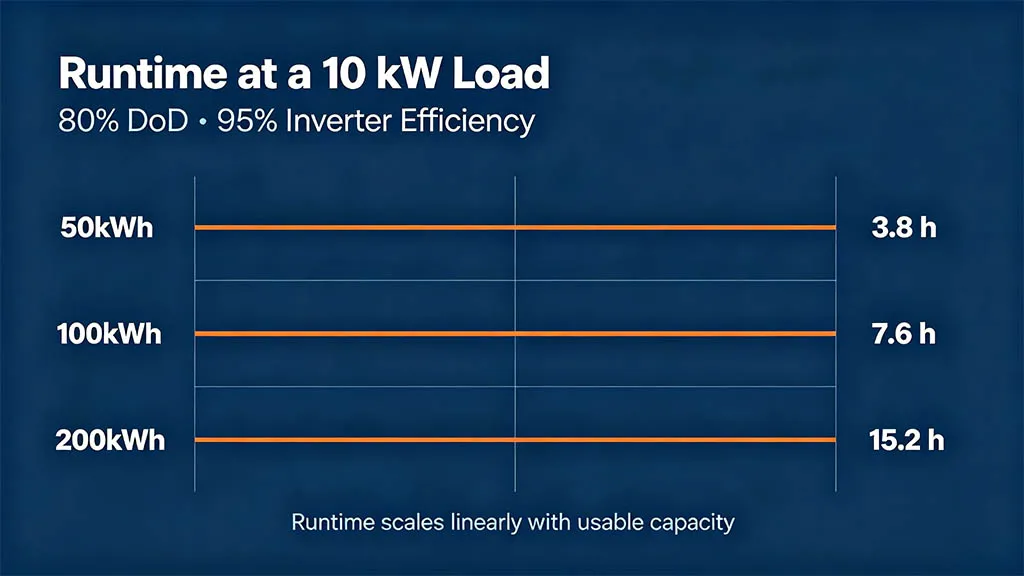
Table 1: Runtime at Different Load Levels (80% DoD, 95% Inverter Efficiency)
| Load (kW) | 50kWh Runtime | 100kWh Runtime | 200kWh Runtime |
|---|---|---|---|
| 5kW | 7.6h | 15.2h | 30.4h |
| 10kW | 3.8h | 7.6h | 15.2h |
| 20kW | 1.9h | 3.8h | 7.6h |
| 30kW | 1.3h | 2.5h | 5.1h |
| 50kW | 0.8h | 1.5h | 3.0h |
| 100kW | 0.4h | 0.8h | 1.5h |
Indeed, runtime scales linearly with capacity: a 200kWh system lasts exactly twice as long as a 100kWh system at the same load. Below roughly 20kW, even a 50kWh battery covers a full working shift, which is why sizing is driven by peak load and target hours, not capacity alone. For an instant answer on your own figures, a how long will battery last calculator performs this division in seconds — the free battery capacity calculator on this site also works backwards: enter your target hours and it returns the kWh you need.
Table 2: Typical Commercial Load Profiles & Required Battery Size
Next, Table 2 maps common commercial scenarios to a suggested system size. Runtime figures are estimates at the typical average load shown, using 80 percent DoD and 95 percent efficiency — your real numbers will differ, so treat them as a starting point for the sizing checklist.
| Scenario | Peak Load (kW) | Daily Energy (kWh) | Suggested Battery | Est. Runtime |
|---|---|---|---|---|
| Small retail shop | 8 | 40 | 50kWh | ~11h at 3.5kW avg |
| Restaurant | 15 | 80 | 100kWh | ~11h at 7kW avg |
| Office building (critical circuits) | 30 | 120 | 200kWh | ~7.6h at 20kW avg |
| Small factory | 50 | 300 | 200kWh | ~6.1h at 25kW avg |
| Data center / critical load | 25 | 400 | 200kWh (bridging) | ~7.6h at 20kW avg |
| Microgrid / community | 60 | 500 | 200kWh+ (parallel) | ~5.1h at 30kW avg |
What Eats Into Your Runtime: 5 Real-World Factors
On paper, the formula assumes a perfect battery at 25°C with a brand-new pack and unlimited discharge current. Real commercial battery backup systems operate inside five constraints that each shrink your runtime. Any battery discharge time calculator that ignores them will overstate your backup hours.
- Depth of Discharge (DoD). LiFePO4 cells are rated for 80-90 percent DoD; lead-acid is limited to 50 percent. For instance, dropping the DoD setting from 90 to 80 percent cuts usable energy by about 11 percent — 20kWh on a 200kWh system.
- Inverter efficiency. Typically, modern inverters run at 93-97 percent, but older or overloaded units drop to 88-90 percent. A 5 percent gap costs roughly 5 percent of your runtime — about 23 minutes per cycle on a 100kWh system at 10kW.
- Temperature derating. Similarly, above 35°C or below 0°C, LiFePO4 capacity falls 5-15 percent. At -10°C a pack may deliver only about 85 percent of nameplate, so a 100kWh system behaves like an 85kWh system on a cold night.
- C-rate limitation. The battery and BMS are rated for a maximum continuous discharge current, usually 0.5C to 1C. Drawing more than the rating triggers current limiting or BMS shutdown, so runtime at high loads is capped by the C-rate first.
- Battery aging. Finally, LiFePO4 capacity fades roughly 2-3 percent per year from cycling and calendar aging. A 10-year-old battery may deliver only 80 percent of nameplate — size for year ten, or you will lose backup hours before the payback period ends.
Peak vs Continuous Load: Why Your Runtime Is Shorter Than the Formula Says
However, the runtime tables assume a steady load; real facilities are not. Motors, compressors, pumps and air-conditioning units draw 2-3 times their running current for the first few seconds at startup, and an inverter sized only for continuous load will trip or fold back the moment a compressor kicks in. This matters most in industrial battery backup installations with large rotating equipment.
A site with a 10kW continuous draw can therefore need a battery and inverter rated for 20-30kW surge. If you want to calculate battery runtime accurately, you must check surge capability first, because a calculation built on 10kW overstates hours if the system cannot sustain the load profile.
Crucially, the BMS current limit is the hard ceiling. Worked example: a 100kWh battery with a 100A BMS discharge limit at a nominal 400V bus can deliver 100 × 400 = 40kW maximum. A 35kW load is within the envelope and runs normally; a 50kW load exceeds it and triggers derating or a hard shutdown, no matter how much energy remains in the pack. This is how to calculate battery runtime correctly for surge-heavy sites: take the minimum of the kWh-derived time and the current-limit-derived power, and design for the surge first.
ROI & Payback: When Does a Commercial BESS Pay for Itself?
To start, runtime answers how long the system lasts on battery; payback answers whether it was worth buying. The payback formula is as simple as the runtime one: Payback (years) = Total Installed Cost ÷ Annual Savings. Annual savings come from shifting energy you would otherwise buy at the grid rate into stored solar or off-peak energy, plus the demand-charge and grid-service benefits that are often the real economic engine of a commercial solar battery storage project.
For context, Table 3 uses realistic 2026 figures for commercial and industrial LiFePO4 BESS: $350-500/kWh installed (lower for larger systems), electricity at $0.20/kWh, and 90 percent of usable capacity cycled daily. Daily shifted energy is 90 percent of usable kWh at 80 percent DoD; annual savings = daily kWh × rate × 365.
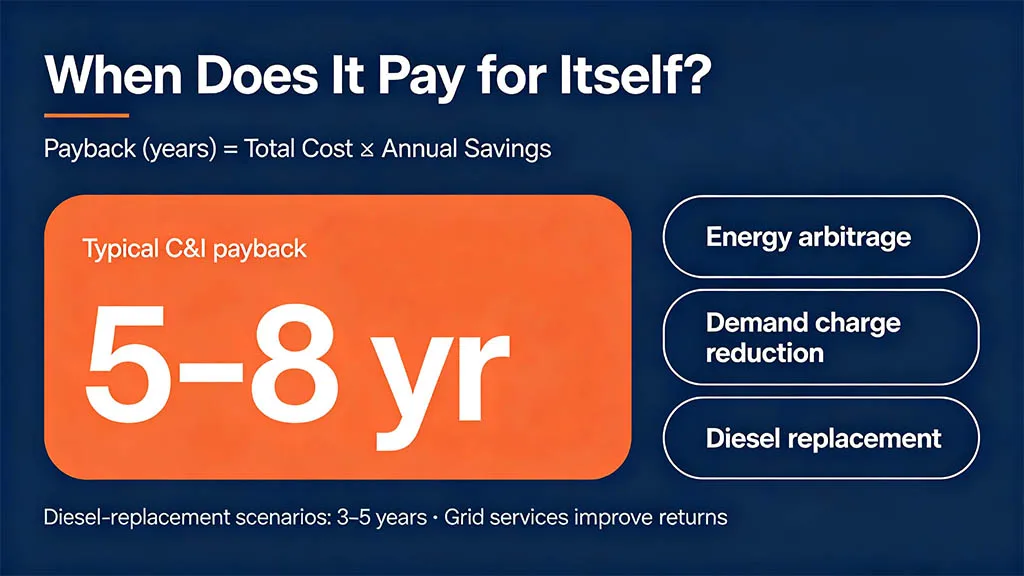
Table 3: ROI Inputs & Sample Calculation (2026 Estimates)
| Parameter | 50kWh System | 100kWh System | 200kWh System |
|---|---|---|---|
| Est. installed cost ($/kWh) | $450 | $400 | $375 |
| Total system cost | $22,500 | $40,000 | $75,000 |
| Daily energy shifted (kWh) | 34 | 68 | 137 |
| Electricity rate ($/kWh) | $0.20 | $0.20 | $0.20 |
| Annual savings (energy shift) | $2,482 | $4,964 | $10,001 |
| Simple payback (years) | 9.1 | 8.1 | 7.5 |
On the one hand, the energy-shift numbers alone give paybacks of roughly 7.5-9 years for these systems. That is rarely the full picture. Demand charge reduction is typically worth $2-6 per kW-month — thousands of dollars a year for a facility with a 100kW peak — peak shaving lets you downsize your utility contract, grid services pay per available MW where markets exist, and replacing diesel generator runtime in weak-grid regions cuts fuel and maintenance costs dramatically. Moreover, adding these revenue streams is what brings a commercial energy storage system payback period into the typical 5-8 year range, and diesel-replacement scenarios can reach 3-5 years.
Before you compare quotes, estimate your daily energy in kWh from your utility bills — the convert watts to kWh tool is a quick way to sanity-check loads — then apply the payback formula. Note that commercial battery storage costs have fallen steadily: a $450/kWh installed price in 2026 is common, but module, balance-of-system and labor prices vary by region and by whether you reuse an existing inverter or buy a turnkey container.
Sizing Checklist: 7 Steps to Right-Size Your Commercial Battery
Right-sizing is a procedure, not a guess. Next, work through these seven steps in order and you will end up with a defensible kWh figure and a payback number.
- ✓ 1. Audit 30 days of interval load data (15-min or 1-hour intervals) from your meter or logger.
- ✓ 2. Identify peak demand and the critical loads that must stay up in an outage.
- ✓ 3. Decide target backup hours (4h / 8h / 12h / 24h) based on outage history and business impact.
- ✓ 4. Calculate required kWh with the battery backup time formula: Load kW × Hours ÷ DoD ÷ Efficiency.
- ✓ 5. Check C-rate and BMS current limits against surge loads (startup currents of motors and compressors).
- ✓ 6. Add 15-20 percent safety margin for aging, temperature and future load growth.
- ✓ 7. Run the ROI / payback calculation before purchasing — a system that cannot pay for itself is a liability, not an asset.
Finally, all of the tools referenced in this article — runtime, capacity and payback math — are collected in the free battery calculators hub, so you can run the full procedure without a spreadsheet.
50kWh vs 100kWh vs 200kWh: Which One Do You Need?
First, the choice usually narrows to one of three standard sizes. Table 4 summarizes the decision. Continuous-load figures assume a 0.5C discharge rating; runtimes use 80 percent DoD and 95 percent efficiency.
Table 4: System Comparison Summary
| Metric | 50kWh | 100kWh | 200kWh |
|---|---|---|---|
| Typical use case | Small retail, telecom shelters, overnight backup | Restaurant, office critical circuits, EV charger buffering | Small factory, data center bridging, microgrid |
| Max continuous load (kW, 0.5C) | 25 | 50 | 100 |
| Runtime at 10kW | 3.8h | 7.6h | 15.2h |
| Runtime at 25kW | 1.5h | 3.0h | 6.1h |
| Est. installed cost | $22,500 | $40,000 | $75,000 |
| Best for | Low daily energy, short outage targets | Medium loads, 4-8h backup | High loads, 8h+ backup or arbitrage |
| Payback range (years) | 6-9 | 5-8 | 5-8 |
Finally, a note on architecture: a 50kWh battery and a 100kWh battery are often the same rack-mount hardware in different quantities. Dawnice manufactures 48V/51.2V rack-mount LiFePO4 batteries from 5-20kWh per rack, parallelable to 100kWh and beyond, and containerized BESS from 100kWh to 2MWh for commercial and industrial projects. In fact, that means the 200kWh column may simply be several racks in a cabinet rather than a custom build.
Common Mistakes in Battery Backup Time Calculation
- Using nominal kWh instead of usable kWh. A 100kWh battery is not 100kWh of backup; at 80 percent DoD the correct input is 80kWh, and the runtime math changes by 20 percent.
- Ignoring inverter efficiency. Likewise, a 100kWh battery never delivers 100kWh of AC power; at 95 percent efficiency the correct figure is 95kWh at the inverter terminals, less wiring losses.
- Sizing for average load instead of peak load. If your average is 10kW but your peak is 40kW, size the inverter and BMS for 40kW or the system folds when it matters.
- Forgetting surge currents. A motor that runs at 5kW can draw 12-15kW for seconds at startup; runtime and wire sizing must both survive the surge, not just the steady state.
- Assuming 100 percent DoD on LiFePO4. Of course, the cells can technically cycle deeper, but 80 percent is the conservative standard that protects the 6,000-8,000 cycle rating; deeper cycling trades battery life for hours.
- Not accounting for annual capacity fade. A system sized with zero margin at year one is undersized by 15-20 percent by year ten; the 15-20 percent safety margin in the checklist is not optional.
Frequently Asked Questions
How do you calculate battery backup time?
Runtime (hours) = (Nominal kWh × DoD × Inverter Efficiency) ÷ Load kW. Example: 100kWh × 0.8 × 0.95 ÷ 10kW = 7.6 hours at 80 percent DoD and 95 percent inverter efficiency.
How long will a 100kWh battery last?
In short, it depends entirely on load. At 5kW: roughly 15 hours. At 10kW: 7.6 hours. At 25kW: about 3 hours — all at 80 percent DoD and 95 percent efficiency. At higher draws, check the BMS current limit first.
What is the difference between battery runtime and battery capacity?
In other words, capacity is the total stored energy in kWh; runtime is how long that energy lasts at a given load, in hours. The same 100kWh battery gives 15 hours at 5kW and 3 hours at 25kW — capacity is fixed, runtime is a function of load.
How do you calculate battery discharge time?
Equally, discharge time uses the same formula: Usable kWh ÷ Load kW. You can also work from C-rate: Time = 1 ÷ C-rate, so a 0.5C discharge rate delivers the full usable capacity in 2 hours, and 1C in 1 hour.
What is a good payback period for commercial battery storage?
Generally, five to eight years is typical for C&I systems with demand charges or high electricity rates. Diesel-replacement scenarios can reach 3-5 years. Below 3 years is excellent; above 10 years usually needs subsidies or grid-services revenue.
Summary: Size for Reality, Not the Datasheet
Battery backup time calculation is simple arithmetic, but the real-world variables — DoD, inverter efficiency, surge currents, temperature and aging — separate a system that works from one that fails when it matters. Next, run your numbers through the free calculators linked in this article before you commit. Dawnice manufactures 48V/51.2V LiFePO4 batteries and containerized BESS from 50kWh to 2MWh for commercial and industrial projects worldwide.